Mapping Mozart
This project was developed as part of the course “Cartographic Design & Geomedia” within the Master programme Applied geoinformatics at the University of Salzburg, Faculty of Digital and Analytical Sciences, Department of Geoinformatics.
Contributors: Andjela Bakovic (Web Map Design & Text), Adamu Isa Muhammed (Story Map) and David Kubanda (Data preparation & Paper Map Design)
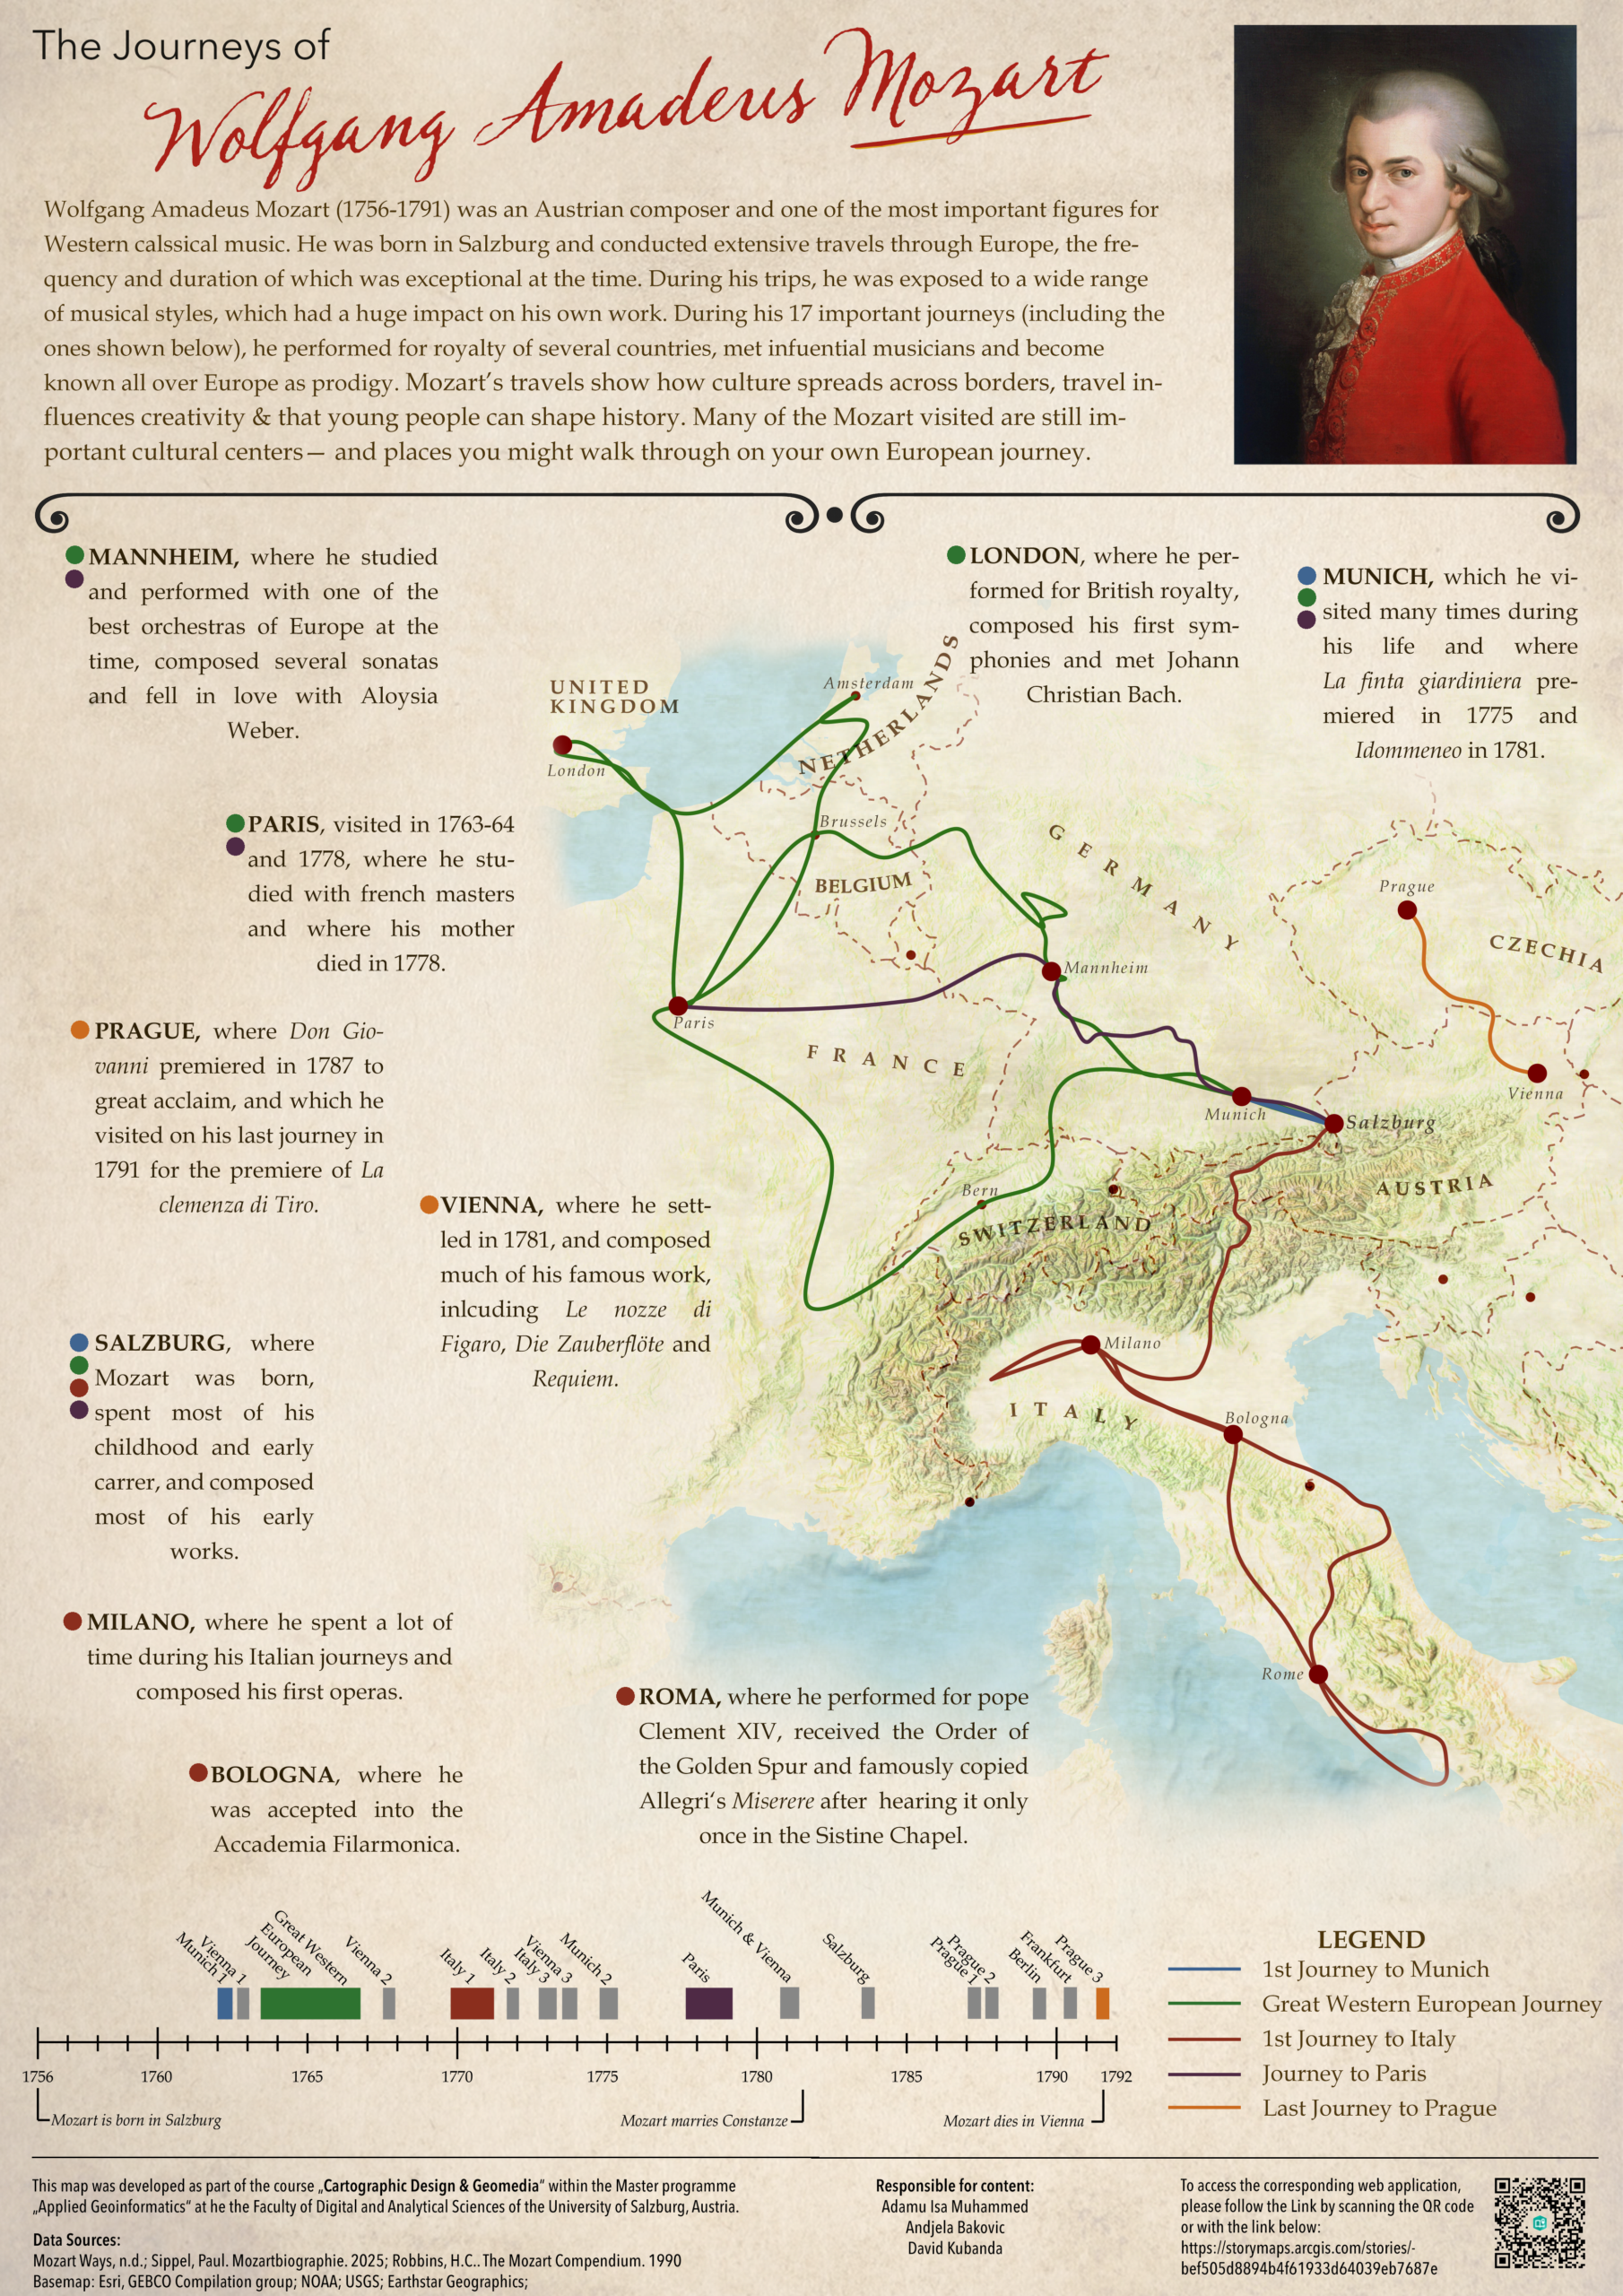
The original idea for this cartography project was to depict Wolfgang Amadeus Mozart’s travels
through Europe and link them to biographical details in order to give viewers an idea of Mozart’s
significance in his time. The maps contain information about Mozart, his music and his
influence on the places he visited. Schoolchildren were identified as the target audience. The
maps are to be used in music and/or geography lessons to show pupils Mozart’s relevance and
how he used the music of the many countries he visited as inspiration and influenced musical
development there through his own works.
In addition to the paper map that is described in this document, a web map application
(StoryMap) was created as well. It is accessible via this link:
Before work could begin on developing the maps, a database had to be created. Our original idea of mapping all of Mozart’s journeys, including all his stops along the way, required an extensive data set of these stops, with information on arrival date, departure date, the coordinates of the place and some additional information. Therefore, the literature (Nissen 1828; Wignall 1991; McKinney n.d.; Sippel 2025; Europäische Mozart Wege n.d.; Landon 1990) was first consulted extensively, and an Excel spreadsheet was created from this research. This list comprises 17 journeys with a total of 283 documented stops. The following statements can be made regarding data quality:
- Positional Accuracy: For most of Mozart’s stops, the exact location of his stay cannot be determined. In rare cases, an address, inn or hotel is documented, but usually only the city. Therefore, it was decided to simplify matters by using only the coordinates of the city for our map.
- Temporal Accuracy: In most cases, the date on which Mozart arrived in a city, as wellthe date on which he left, is recorded. There are, however, instances where only “end ofJune”, or “late autumn” is recorded. For most stops, the temporal accuracy is therefore1 day, in rare cases up to a few months.
- Completeness: As Mozart lived over 230 years ago, we have to rely on recorded data frombiographies and research. To what extent the information taken from the literature iscorrect, cannot be determined in this project. However, it has to be noted, that for manyof the smaller towns where Mozart only passed through, no arrival and/or departure dateis available. This is the case for 180 of 283 of arrival dates and 228 of 283 departure dates.
In the next step, the list of towns and cities was geocoded to acquire georeferenced location
information that can be used in the GIS software. For this purpose, the online geocoding
tool geoapify (https://www.geoapify.com/tools/geocoding-online) was utilized. It allows for
the upload of address parts, which the tool then converts to coordinates. Then, a new project
was created in ArcGIS Pro. In the INSPIRE Specification on Coordinate Reference Systems –
Guidelines paper, the authors recommend the use of Lambert Conformal Conic (ETRS89-LCC,
espg:3034) for “conformal pan-European mapping” (INSPIRE Thematic Working Group 2009).
Therefore, this CRS was chosen for this project.
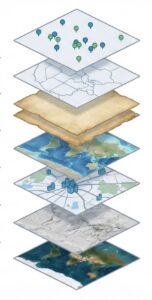
None of the basemaps provided by esri met the visual requirements for this project, therefore
one was created from scratch. An Online Tutorial by John Nelson served as a very helpful
input for techniques and data sources (Nelson 2024). To create a “vintage style” basemap, the
following layers were combined:
- World Cities from the ArcGIS Hub (esri 2025a). In order not ot overload the basemap, only national capitals were displayed.
- Inland borders layer
- 2 Layers of Parchment from the Living Atlas (Nelson 2025b)
- Bathymetry Light from the Living Atlas (Nelson 2025a)
- Human Geography from Living Atlas (esri 2026a)
- World Hillshade from Living Atlas (esri 2025c)
- World Imagery Layer from Living Atlas (esri 2026b)
It was decided to show the same 5 journeys in the paper map that were finally selected for the
web map as well, being:
- Mozarts first journey to Munic (1762)
- The Great Western European Journey (1763-1766)
- The first journey to Italy (1769-1771)
- The journey to Paris (1777-1779)
- Mozarts last journey to Prague (1791)
In order to create visually appealing lines for display, firstly the table containing the stops of
each journey was imported into ArcGIS Pro. Then, the tool “XYZ Table to Point” was used to
create point feature classes from the tables by using the Lat and Lon columns as input for the
spatial representation. To create lines from these points, the tool “Points to Line”
was used. Since the resulting travel lines were really jagged, they were smoothed using the Belzier interpolation feature of the “Smooth Line” tool from the Cartography toolbox. Finally, some stops were discarded for the sake of simplicity and visual appeal. For example, parts of the return journeys were removed, as well as loops and small detours. The resulting lines are shown below. From all the stops, only a few very important ones were shown of the map as large points, all the others are not represented apart from being part of the travel line.
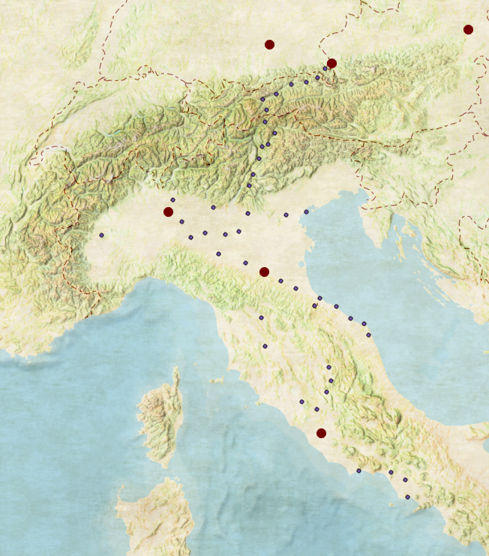 Points from Table
 Points to Line
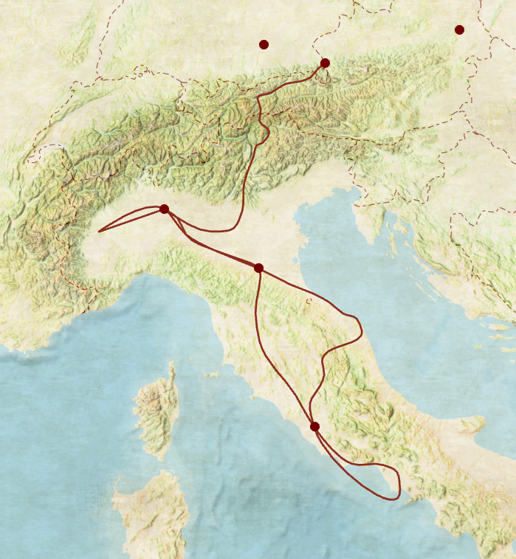 Smoothed & simpified
Finally, a solution had to be found to display all the necessary elements on one page. The format used was A3, which is large enough to be hung up in the classroom, but still small enough to fit into the students’ personal learning documents (folded) and can also be easily reproduced in large quantities by the teacher on conventional printers. The map section with the basemap and the journeys formed the basis around which the rest was constructed. To do justice to the
historical ‘vibe’ of the map, a parchment background was used. Next, the following elements
from the web map were replaced with alternatives suitable for printing:
- Introduction section: in the web map, a introduction with text and links to audio samples
is the first thing the user sees. Therefore, in the paper map, a short introductory text
was placed at the top together with the title and a portrait of Mozart. - Popups: One of the most important features of the web map is the pop-up function,
where the user can click on important cities to get additional information, images and
audio samples. In the paper map, text boxes were placed around the map area, which
include very brief summaries on the cities. - The sidecar: In the web map, this functionality allows the user to scroll through the
journeys, which are sorted in a temporal order. Initially, no solution to give the paper
map temporal context was found for the first draft. - Since the trips are all shown together on one map, it is quite difficult for the reader to determine the chronological order by carefully reading the introductory text and the text boxes. This is not really intuitive, while it is precisely this chronological order that is really interesting and relevant to the reader. Therefore, a timeline was added to enable the journeys to be arranged chronologically. This is located below the map and spans from Mozart’s birth to his death. All journeys undertaken are marked, with the width of the bars indicating the duration of the journey. Among all the journeys shown, the five that also appear on the map are marked in the respective colours. This allows for a simple, intuitive association between the cities (text fields), the travel routes on the map, and the travel dates in the timeline.
Some features could naturally not be represented in the paper map, such as audio playback,
zoom and pan or dynamic symbology. On the bottom of the paper map, a section with data sources, imprint and a link to the webmap was placed. The finished map is displayed below:
References:
- esri. 2025a. ‘World Cities’. September 11. https://hub.arcgis.com/datasets/6996f03a1b364dbab4008d99380370ed 0/explore?location=45.993988,18.561597,5.
- esri. 2025b. ‘World Countries Generalized’. September 12. https://hub.arcgis.com/datasets/esri::world-countries-generalized/about.
- esri. 2025c. ‘World Hillshade’. Map. October 24. https://www.arcgis.com/home/item.html?id=1b243539f4514b6ba35e7d995890db1d.
- esri. 2026a. ‘Human Geography Detail’. January 29. https://www.arcgis.com/home/item.html?id=97fa1365da1e43eabb90d0364326bc2d.
- esri. 2026b. ‘World Imagery’. Basemap. February 6. https://www.arcgis.com/home/item.html?id=10df2279f9684e4a9f6a7f08febac2a9.
- Europäische Mozart Wege. n.d. ‘Mozarts Reisen’. Mozart Ways. https://mozartways.squarespace.com/mozarts-reisen.
- INSPIRE Thematic Working Group. 2009. ‘D2.8.I.1 INSPIRE Specification on Coordinate Reference Systems – Guidelines’.
- Landon, H. C. Robbins (Howard Chandler Robbins). 1990. The Mozart Compendium: A Guide to Mozarts Life and Music. With Internet Archive. New York: Schirmer Books. http://archive.org/details/mozartcompendium00land.
- McKinney, Roger W. n.d. ‘Mozart’s Travels’. Active Research. https://owd.tcnj.edu/ mckinney/mozarts travels.htm.
- Nelson, John. 2024. ‘Make a Vintage Basemap in ArcGIS Pro’. ArcGIS Blog, August https://www.esri.com/arcgis-blog/products/arcgis-living-atlas/mapping/make-a-vintagebasemap-in-arcgis-pro-with-some-living-atlas-shenanigans.
- Nelson, John. 2025a. ‘Bathymetry Light’. October 10. https://www.arcgis.com/home/item.html?id=d27834f9df384c56b3099d663071b5c1.
- Nelson, John. 2025b. ‘Parchment Texture’. October 10. https://www.arcgis.com/home/item.html?id=34b03208322246b08665189c0fffab7b.
- Nissen, Georg N. von. 1828. Biographie W.A. Mozarts. With Bavarian State Library. Leipzig.
http://archive.org/details/bub gb 2lpDAAAAcAAJ. - Sippel, Paul. 2025. ‘Mozartbiographie – Konzertreisen’. Mozartbiographie.
https://www.mozartbiografie.de/index.php. - Wignall, Harrison James. 1991. In Mozarts Footsteps. With Internet Archive. New York:
Paragon House. http://archive.org/details/inmozartsfootste0000wign.